Success with AI/ML depends first and predominantly on your data. “Garbage in, garbage out” is both a familiar and accurate refrain. The integrity of your data pipeline will be the biggest determinant of whether you are able to produce impactful AI/ML products to solve critical problems—the kind that face us in every industry to address health, habitat, mobility and governance. A proper data pipeline must retain precision and fidelity to accurately present the raw material for MLOps. Cleaning and enhancement—typically human curated—attempts to produce a truly representative dataset needed to create an accurate model. Synthetic data purveyors proclaim that fake data is as good or better than real data despite the limitations of their foundational technology. However, structured data fidelity is the critical factor that synthetic data cannot deliver, and when absent, accurate models are impossible to achieve, especially when rare instances are present. If data privacy law compliance is needed and the use of the original sensitive data isn’t an option, current PETs are insufficient in offering the needed compliance and data fidelity.
Data scientists must identify and preserve rare instances in datasets to solve critical problems in many use cases such as rare disease, fraud, or security detection, et al, within an AI/ML task. If these rare instances are not preserved, then success is not possible. For example, in life sciences, the genome-wide association studies (GWAS) method identifies genetic markers associated with rare disease. These small sets of rare disease instances exist in a multitude of normal instances and their identification is crucial and tantamount to finding the proverbial needle in a haystack. From fraud detection in the fintech sector to machine failures in manufacturing, the list of critical problems in every industry for rare instance identification is endless.

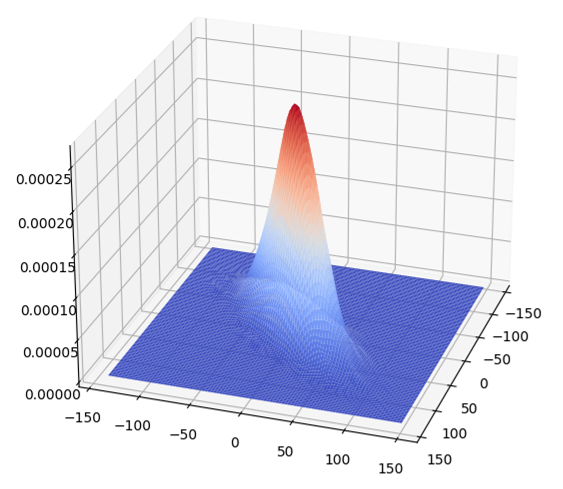
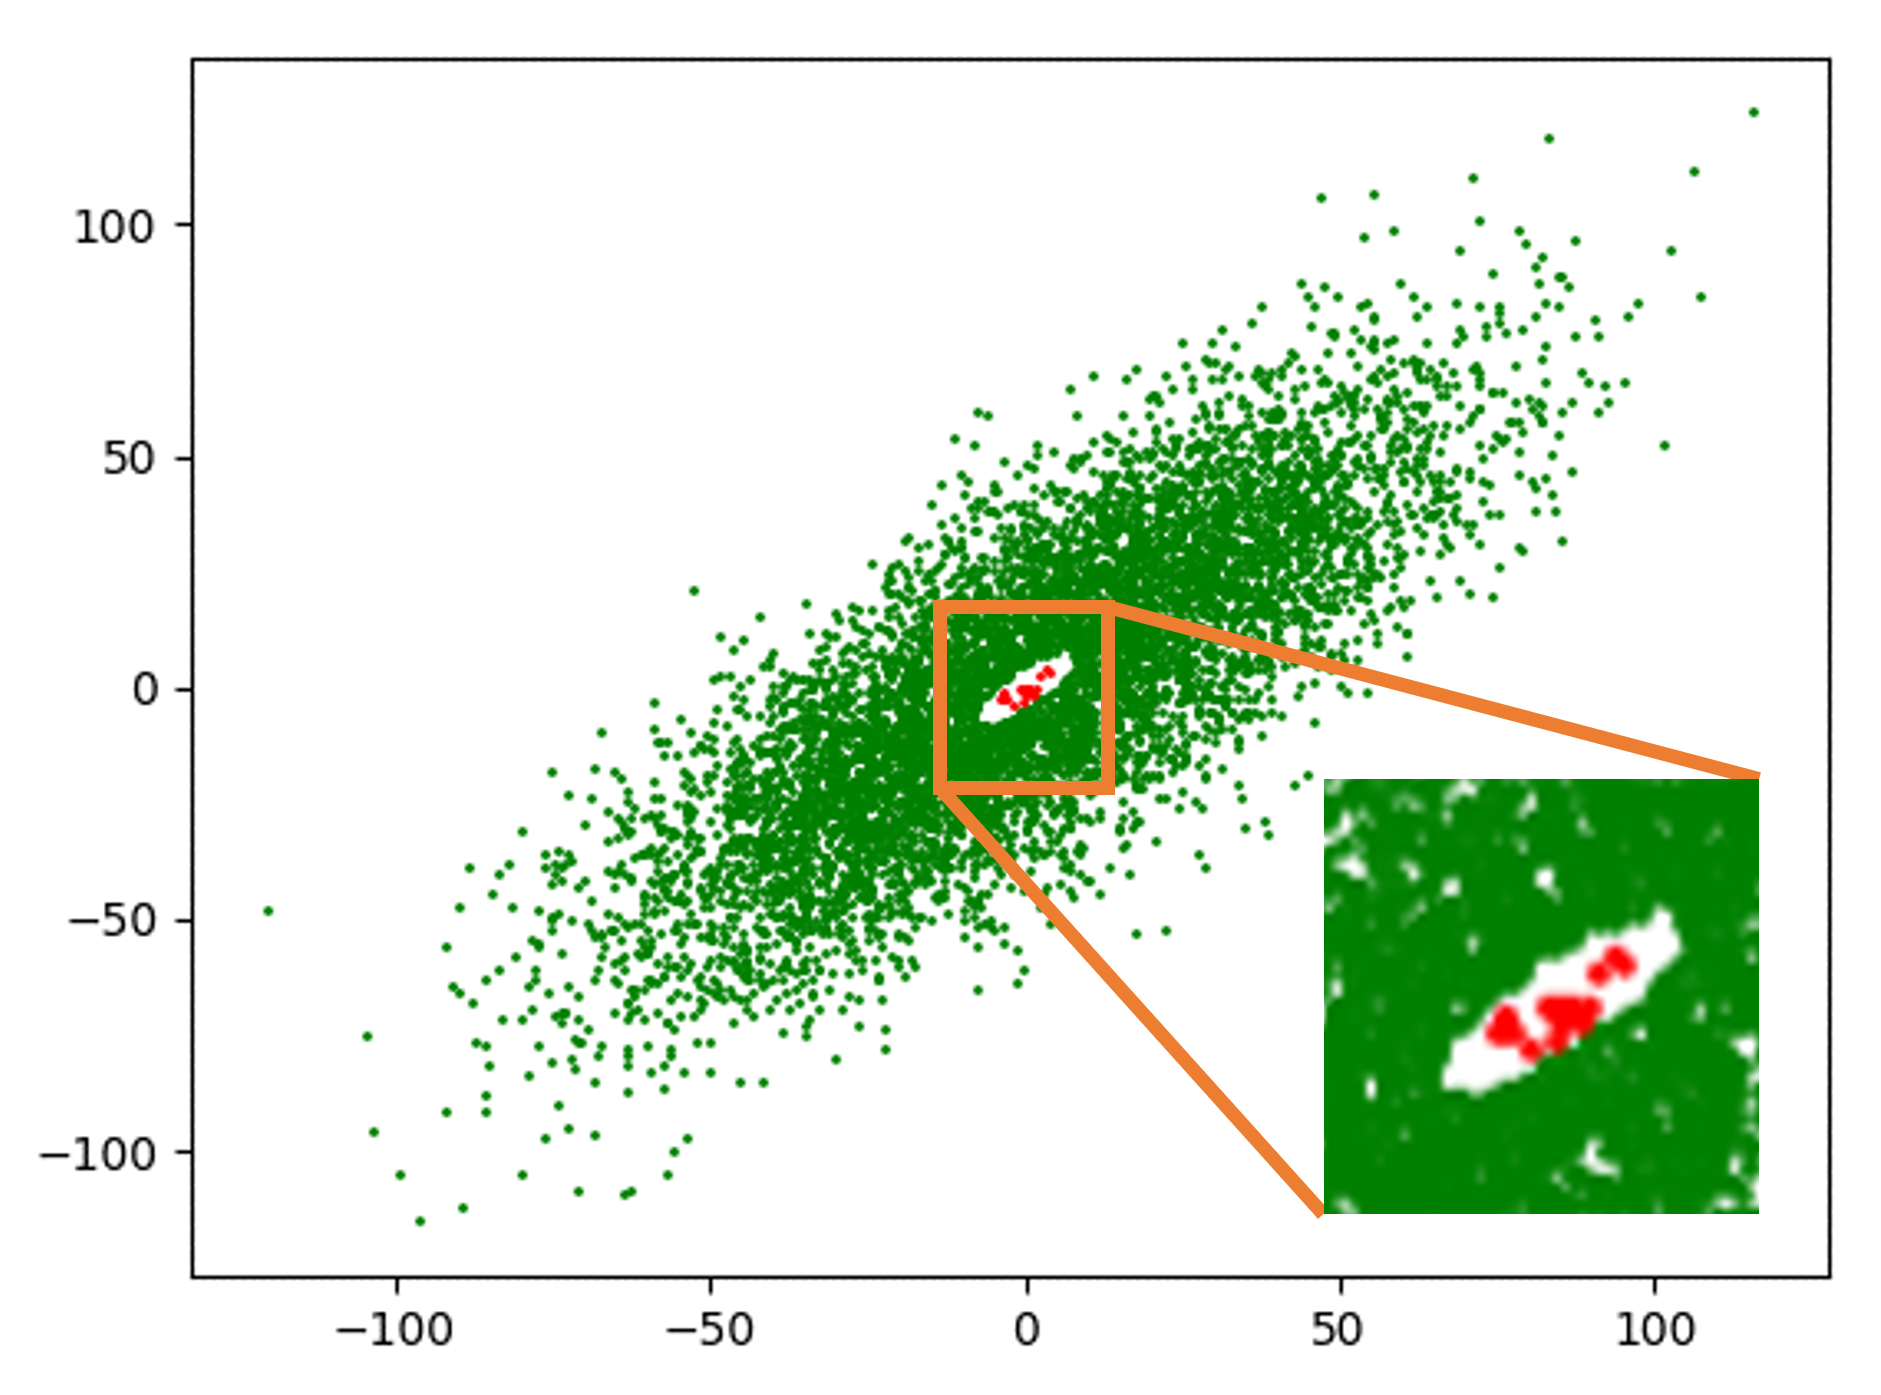
Methods like synthetic data generation cannot preserve rare instances for AI/ML model training purposes because they first model the dataset with a probability distribution function, and then sample this probability distribution function to generate more data. The fundamental problem lies in the estimation of the probability distribution function which would obnubilate any infinitesimally small number of rare instances (sets of measure zero) in a cloud cover that encompasses and “explains” the more prevalent instances. Consider the Gaussian data cluster of about 7000 points marked in green shown in Figure 1, at the center of which there is a tiny hole containing 20 red rare instance points magnified in the inset. The cloud cover of the distribution estimator estimates this data distribution as a single 2-dimensional Gaussian Probability Density Function (PDF), a surface plot of which is shown in Figure 2, and the 20 rare instances vanish as far as any subsequent data analysis or data visualization is concerned. Further corroboration of this inability of synthetic data to preserve rare—aka low probability—events is provided in the survey papers referred below and in the extensive references given in them.
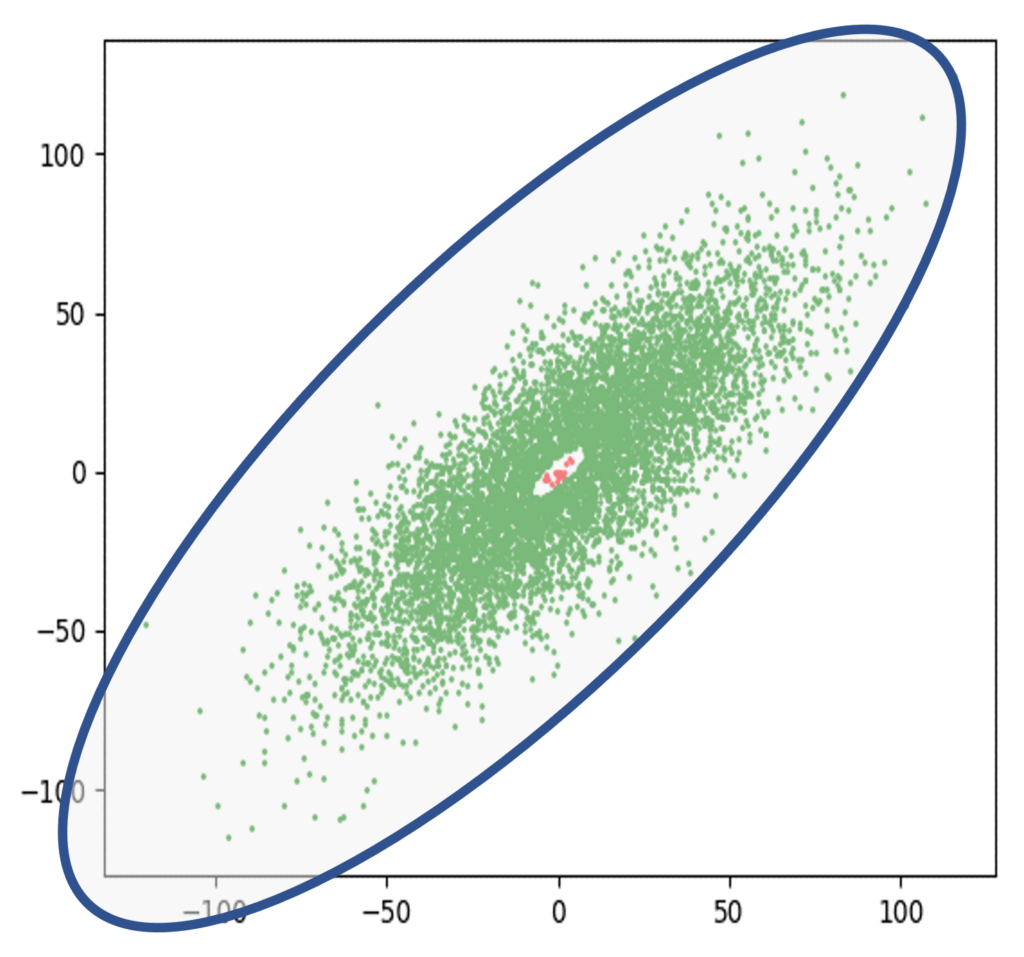
Given this inability to preserve rare instances, synthetic data purveyors claim that a good outlier detection mechanism in the analysis of a dataset can be used in lieu of any rare instance identification mechanism—the idea being that once the big non-rare instances have been modeled by probability distributions, extremal boundaries—aka thresholds—can be set from the parameters of these distributions, and any point going beyond these thresholds can be identified as rare instances or outliers. This claim, of course, is false. Given that a single 2-dimensional Gaussian PDF has been estimated, with its only parameters being its mean μ and standard deviation σ, its extremal boundaries can be set as a function of these parameters. This extremal boundary would be an ellipse surrounding the green cluster as shown in Figure 3—a generalization of the μ±3σ rule for 1-dimensional Gaussians. Any point going outside the ellipse would be regarded as a rare instance or outlier. Unfortunately, this rule would never be able to identify the few red rare instances that exist in the hole at the center of the cluster. On the contrary, such a model would expect the most “normal” samples to occur at the center of the cluster.
In other words, if you need to solve a problem using structured data to identify rare instances, your choices are limited to the original data or a technology other than synthetic data that provides high data fidelity and is a statistical equivalent of the original data. Otherwise, you risk running ‘Vegas odds of success’ in predicting use cases reliant upon rare instances—a new world that we must now address.
References
Chen, R.J., Lu, M.Y., Chen, T.Y. et al. “Synthetic data in machine learning for medicine and healthcare.” Nat Biomed Eng 5, 493–497 (2021). https://doi.org/10.1038/s41551-021-00751-8
Jordon, J., Szpruch, L., Houssiau, F. et al. “Synthetic Data — what, why and how?” Report commissioned by the Royal Society (2022). https://arxiv.org/pdf/2205.03257.pdf