
Third in a Series: Mastering data quality for safe and scalable AI
Saibal Banerjee, PhD and Steven Atneosen, JD
Introduction
If there’s one tool every data scientist should master, it’s the confusion matrix. Despite its simplicity, it offers unparalleled insight into model performance, including class-wise behaviors, average trends, systemic biases, and types of errors. If you can’t measure model performance, you can’t manage it for accuracy or ensure that it falls within global compliance boundaries.
A confusion matrix is the most fundamental tool to evaluate classifiers. Given a classifier that classifies a test sample into n classes, its confusion matrix C is an n by n matrix with the manually labeled actual class values arranged along its columns and the predicted class values by the classifier along its rows. Almost all classifier black-box performance metrics are based on calculations performed on the confusion matrix. The entry in row i and column j of the confusion matrix C gives the number of test samples that have predicted value i and actual value j.
Structure and Interpretation
An example of a confusion matrix C for a 3-class classifier that identifies dogs, cats, and pigs from a manually labeled test sample of their pictures looks as shown in Figure 1 below.
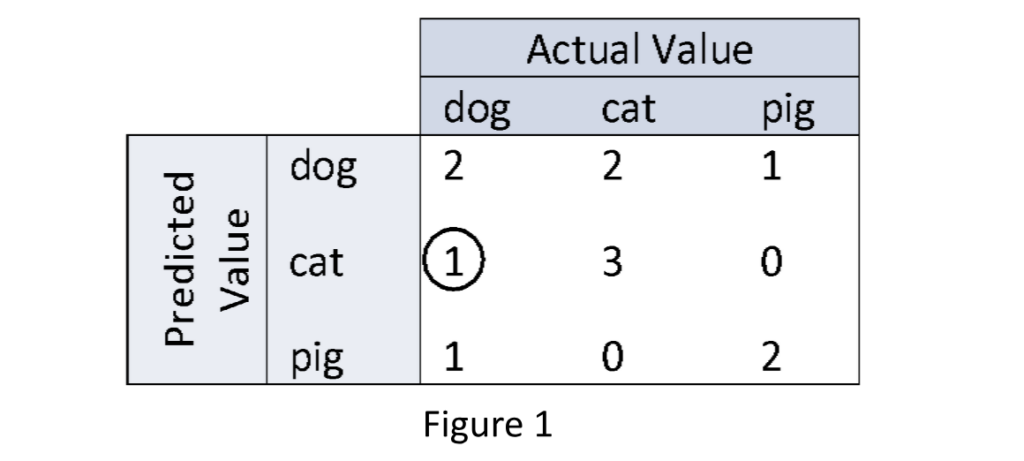
The diagonal values in C represent the number of correct classifications, whereas the off-diagonals represent misclassifications. In particular, the encircled count of 1 in the 2nd row and 1st column of the confusion matrix C shown in Figure 1, gives the number of dog samples that have been misclassified as cats. If you find by testing your classifier model on various samples that such is often the case, i.e. your model frequently misclassifies dogs as cats, then you can generate ambiguous examples that blend features of cats and dogs, observe how model predictions shift and adjust your model accordingly. In this case, one directly uses the off-diagonal entries of a confusion matrix for edge case testing with generated data or features for model tweaking purposes.
Confusion matrices can also reveal demographic bias. Using generated data from tomtA.ai, one can create test sets with diverse synthetic identities to uncover performance discrepancies by age, gender, or ethnicity.
Other informative performance metrics that one can derive from a confusion matrix include:
- Accuracy.
- Precision, Recall, F1 scores, etc. on a per class basis.
- Above class based scores macro, micro, and weighted averaged over all classes.
- Other class-averaged scores like the Fowlkes-Mallows index of precision and recall, the Matthews Correlation Coefficient (MCC), etc.
Accuracy
The accuracy A of a classifier for a given test sample is the most fundamental performance measure that can be derived from its confusion matrix C. It is the proportion of the true positives in the confusion matrix, where a true positive count is equal to the number of samples where the actual and the predicted class values agree – i.e. the diagonal values of C. In other words, the accuracy A is equal to the sum of the diagonal counts of C divided by the total counts in C, which for the matrix in Figure 1 is 7÷12 = 58.33%.
Precision
Unlike accuracy which is an overall metric, precision is a metric that is defined on each predicted class value. For a given test set, it answers the following question: How often is a particular value predicted by the classifier correct?
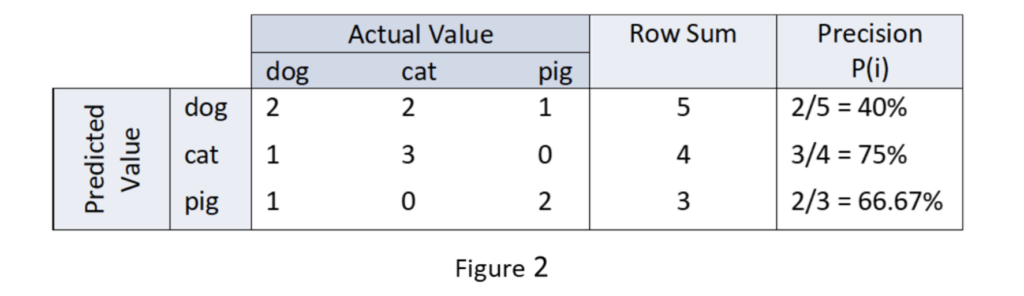
In terms of the confusion matrix C, the precision P(i) of predicted class value i is given by the diagonal entry in row i divided by the sum of the entries in row i as shown above in Figure 2. The precision of predicted class values of dog, cat, and pig are calculated in Figure 2 for the confusion matrix shown in Figure 1.
Recall
While precision is defined on predicted class values, recall is defined on the actual class values. Given the test set, it answers the following question: How often does the classifier predict an actual class value correctly?
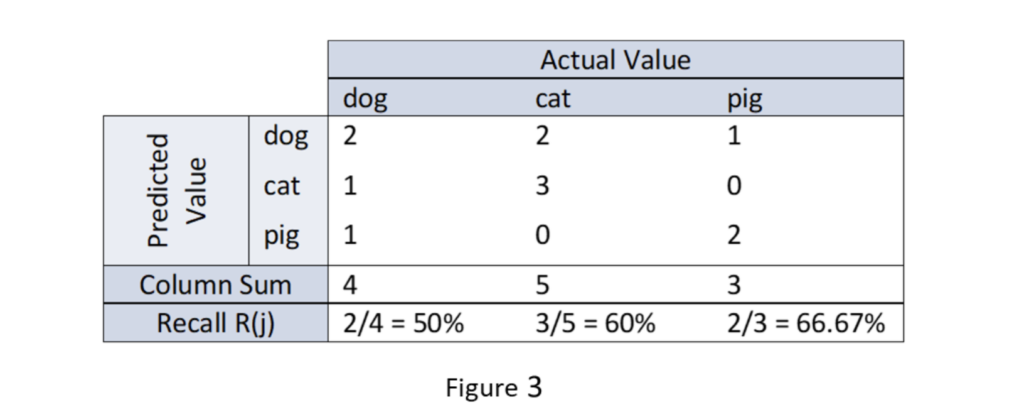
In terms of the confusion matrixC, the recall R(j) of predicted class value j is given by the diagonal entry in column j divided by the sum of the entries in column j as shown above in Figure 3. The recall of actual class values of dog, cat, and pig are calculated in Figure 3 for the confusion matrix shown in Figure 1.
Takeaway
Use confusion matrices for unparalleled insight into model performance, including class-wise behaviors, average trends, systemic biases, and types of errors. Remember: if you can’t measure model performance, you can’t manage it for the requisite overall accuracy, class-based precisions and recalls, or ensure that it falls within global compliance boundaries. Add a superpower like safely generated data from tomtA.ai to address all contingencies to ensure that your model performance moves the needle for your business.
Stay tuned for our next blog in the “Mastering Data Quality for Safe & Scalable AI” series: Weighted Metrics: When and Why They Matter.
Request our full technical paper at the “Book a Demo” button on our website.